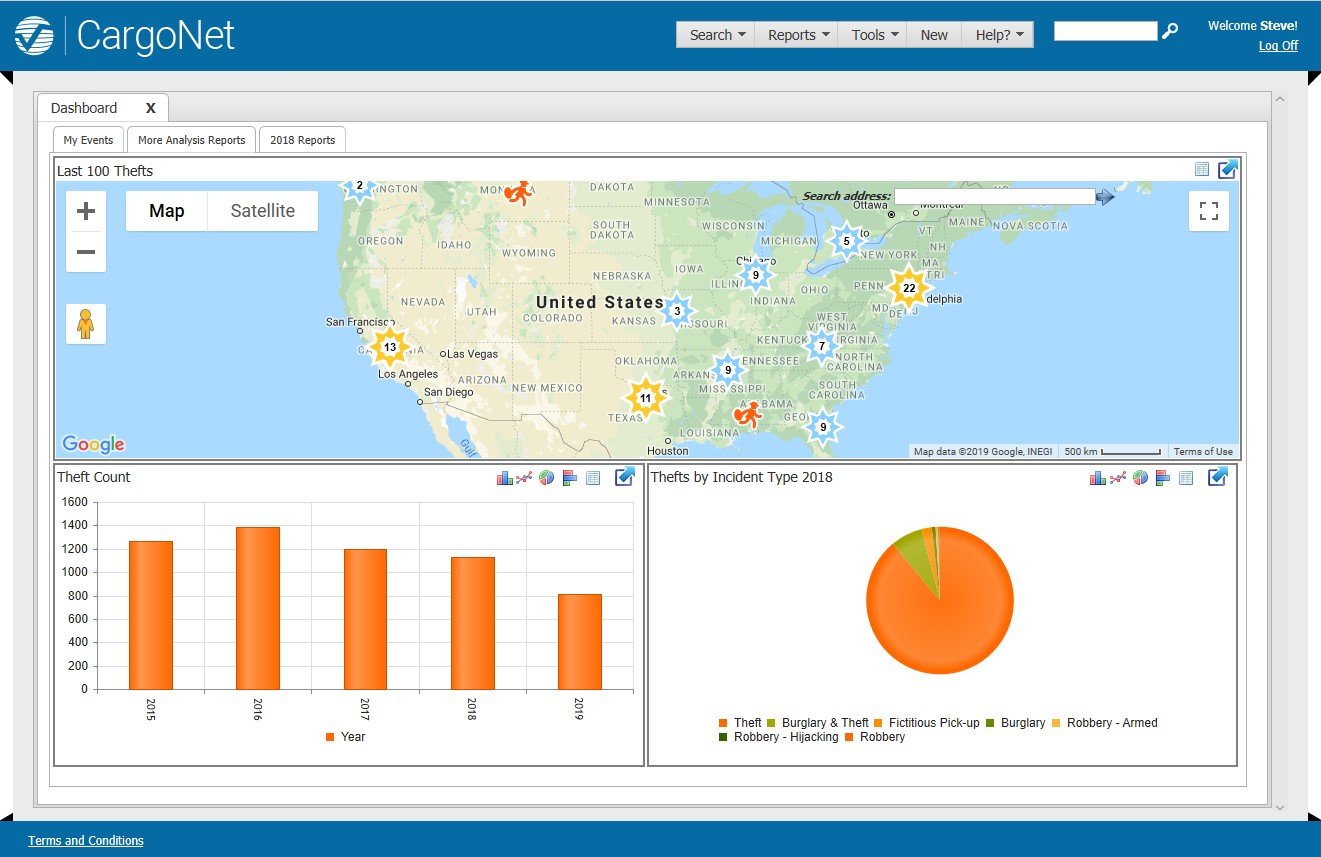
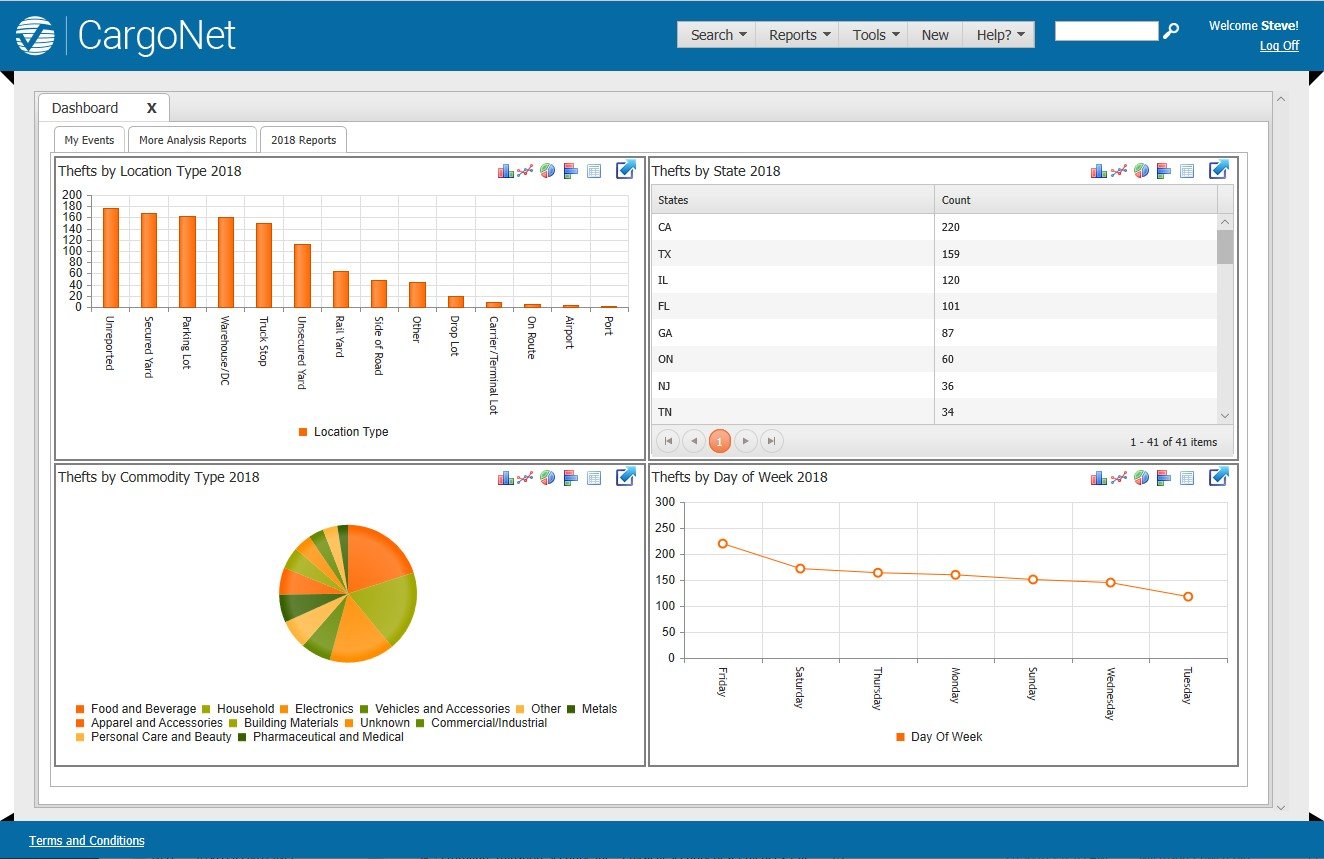
CargoNet members the ability to view charts, maps and graphs in real-time to better identify your risks as it relates to cargo theft. We are optimistic you will and these enhancements to your liking and hopeful you will take advantage of this new tool to aid in your proactive protocols to compliment your theft prevention methods.
Over 35 new charts and graphs by:
Theft Count
Commodity Type
Day of Week
Incident Type
Location Type
Thefts by Month
Thefts by Quarter
Thefts by State
Query and Filter the Last 100 Thefts & Last 500 Thefts Reported by:
We use cookies on this site to enhance your user experience. By continuing to use this site you are giving us your consent to place cookies on your device.
We use cookies on this site to enhance your user experience. Please tick the box to indicate you are giving us your consent to place cookies on your device.